Types of Maps: A Complete Guide to Different Maps
Understanding the types of maps can make geography much easier to learn. Maps are visual tools that help us understand places, distances, boundaries, natural features, and many other kinds of information. However, not every map is designed for the same purpose. A political map may show countries and borders, while a physical map may focus on mountains, rivers, and other natural features.
Maps are used in schools, travel, science, business, government, and everyday life. Learning the main types of maps helps you understand what information each map provides and how to read it correctly.
What Are the Different Types of Maps?
There are many types of maps, and each one presents geographic information in a different way. Some maps focus on physical features of Earth, while others show human activities, political boundaries, transportation routes, or specific data.
The most common types include political maps, physical maps, topographic maps, road maps, climate maps, weather maps, and thematic maps.
Some maps can also combine several features. For example, a map may show political boundaries while also displaying major rivers and mountains.
1. Political Maps
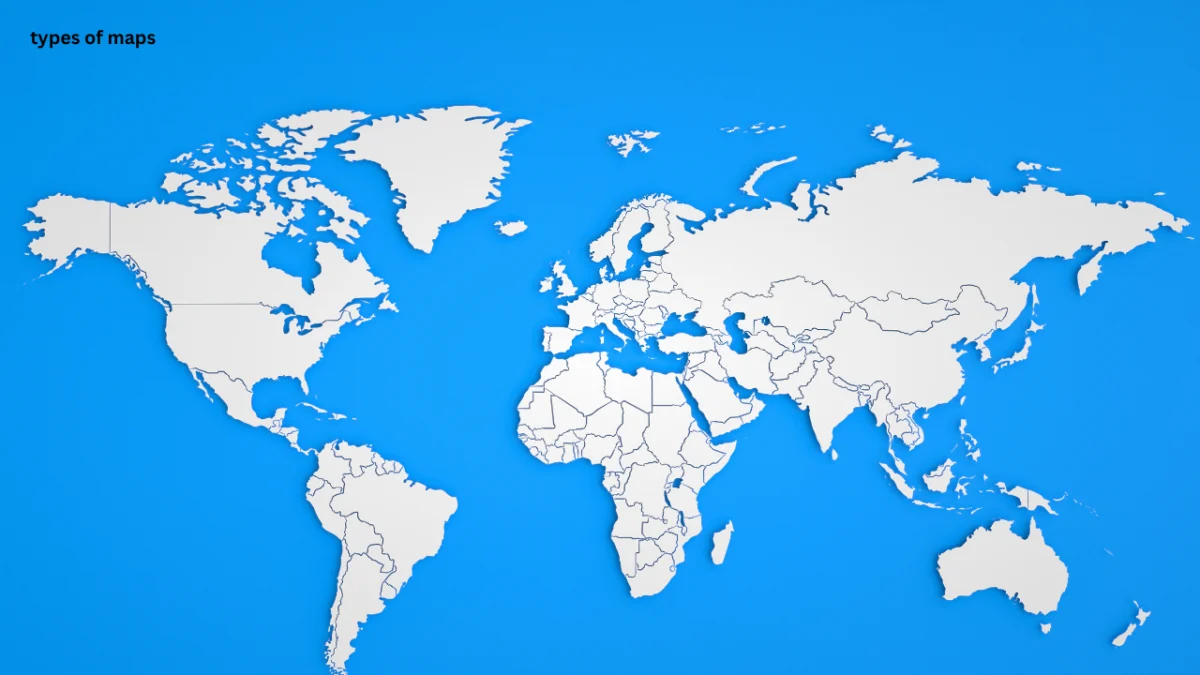
A political map shows boundaries created by people or governments. These boundaries may separate countries, states, provinces, counties, or other administrative regions.
Political maps usually highlight countries and major cities. Different colors may be used to make neighboring countries or regions easier to distinguish.
These maps are especially useful for learning about the political organization of the world. Students often use them to identify countries, capitals, states, and international boundaries.
For example, a political map of Europe can show the locations and boundaries of countries such as France, Germany, Italy, and Spain.
Political maps generally focus on human-made boundaries rather than the physical shape of the land.
2. Physical Maps
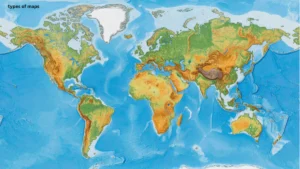
Physical maps show natural features found on Earth’s surface. These features can include mountains, rivers, lakes, deserts, valleys, oceans, and other landforms.
Colors are often used to represent different elevations and types of terrain. Green may represent lower land in some maps, while brown or other shades can indicate higher elevations.
Physical maps are useful because they help readers understand the natural landscape of a region.
For example, a physical map of the United States can show the Rocky Mountains, Mississippi River, Great Plains, and other major geographic features.
Unlike political maps, physical maps are mainly concerned with Earth’s natural environment.
3. Topographic Maps
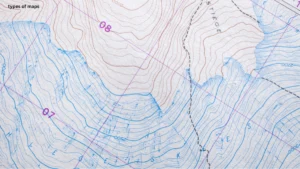
A topographic map provides detailed information about the shape and elevation of land. It can show mountains, valleys, hills, rivers, roads, buildings, and other physical or human-made features.
One of the most important features of a topographic map is the contour line. Contour lines connect points that have the same elevation.
When contour lines are close together, the land is usually steep. When they are farther apart, the slope is generally more gradual.
Topographic maps are used by hikers, engineers, surveyors, scientists, planners, and others who need detailed information about terrain.
They can be more complex than simple political or physical maps, but they provide valuable information about the shape of the land.
4. Road Maps
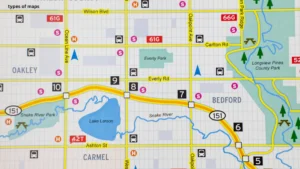
Road maps are designed to help people understand transportation routes. They can show highways, streets, roads, bridges, intersections, and important destinations.
Traditional road maps were printed on paper and were commonly used by drivers when planning long journeys. Today, digital navigation systems have made route planning much easier, but road maps remain useful for understanding transportation networks.
A road map may also identify airports, railway stations, towns, parks, and other important locations.
The main purpose of a road map is to help people understand how different places are connected by roads and transportation routes.
5. Thematic Maps
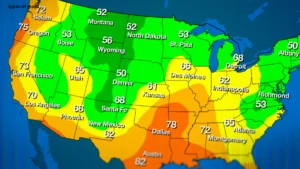
A thematic map focuses on a particular subject or theme rather than simply showing general geographic features.
For example, a thematic map might show population density, rainfall, unemployment, agricultural production, literacy rates, or economic activity.
These maps are especially useful when researchers need to identify geographic patterns.
A population map, for instance, can show which areas have high or low population density. A rainfall map can help readers compare precipitation levels across different regions.
The information displayed on a thematic map depends on its specific purpose.
6. Climate Maps
Climate maps show information about the long-term climate conditions of different regions. They can display patterns such as average temperature, rainfall, precipitation, or climate zones.
Climate maps are useful for studying how weather conditions vary across large areas over long periods.
Students and researchers can use these maps to understand why some regions are hot and dry while others are cold or receive large amounts of rainfall.
Climate maps can also help scientists study changes in climate patterns over time.
7. Weather Maps
Weather maps are different from climate maps because they generally show current or short-term atmospheric conditions.
A weather map may display temperature, air pressure, wind direction, precipitation, storms, or weather fronts.
Weather maps are widely used by meteorologists to analyze atmospheric conditions and prepare forecasts.
Television weather reports and online weather services often use simplified versions of weather maps to help the public understand upcoming conditions.
The key difference is that climate describes long-term patterns, while weather describes atmospheric conditions at a particular time or over a short period.
Why Are There So Many Types of Maps?
Different maps exist because geographic information can be used for many different purposes.
A traveler may need a road map. A student may need a political map to learn countries. A scientist may need a topographic or thematic map to study a specific geographic pattern.
Trying to put every possible type of information on one map would make it difficult to read. Specialized maps solve this problem by focusing on the information that matters most for a particular task.
This is why choosing the right map is just as important as knowing how to read one.
8. Navigation Maps
Navigation maps are designed to help people find locations and plan journeys. They can show roads, routes, directions, landmarks, and other useful information for reaching a destination.
Modern navigation maps are often digital. GPS technology allows navigation systems to determine a user’s location and suggest routes.
People use navigation maps while driving, walking, cycling, or using public transportation. These maps may also provide information about traffic, road closures, and estimated travel times.
9. Population Maps
Population maps show information about where people live and how populations are distributed across an area.
Some population maps show the total number of people in different regions. Others focus on population density, which compares the number of people with the size of an area.
These maps can help researchers and governments understand population patterns. They can also be useful when planning schools, hospitals, transportation systems, and other public services.
10. Resource Maps
Resource maps show the locations or distribution of natural resources. These may include minerals, forests, oil, natural gas, water resources, or agricultural land.
Governments, researchers, and industries can use resource maps to understand where valuable resources are located.
Because natural resources can affect economic activity and environmental planning, these maps can provide important information for decision-making.
11. Economic Maps
Economic maps focus on economic activities and patterns in different geographic areas.
They may show industries, agriculture, trade, employment, income levels, or the production of particular goods.
For example, an economic map could show major agricultural areas or regions where a specific industry is concentrated.
These maps help people understand the relationship between geography and economic activity.
12. Geological Maps
Geological maps show information about rocks, minerals, and the structure of Earth’s surface.
They can identify different rock formations and geological features across a region. Scientists and engineers use geological maps to study Earth’s history and understand the materials beneath the surface.
These maps can also support activities such as construction, mining, environmental research, and natural resource management.
How to Choose the Right Map
Choosing the right map depends on the information you need.
If you want to identify countries and borders, a political map is usually the best choice. If you want to study mountains and rivers, a physical map may be more useful.
For detailed information about elevation and terrain, a topographic map is appropriate. If your goal is to study a specific subject such as population or rainfall, a thematic map can provide more useful information.
The key is to understand the purpose of the map before interpreting its information.
How to Read Different Maps
Although maps can look very different, many share several basic features.
The title tells you what the map represents. The legend or key explains symbols and colors. The scale helps you understand distances, while a direction indicator can show north, south, east, and west.
You should also pay attention to labels and the date of the map. Geographic information can change, so an older map may not represent current conditions.
Reading these features together makes it easier to understand what a map is communicating.
Digital Maps vs. Paper Maps
Digital and paper maps both have advantages.
Digital maps can provide real-time information and interactive features. Users can zoom in, search for locations, receive directions, and sometimes view traffic or satellite imagery.
Paper maps do not require batteries or an internet connection. They can also provide a broad overview of a large area without requiring users to navigate through a digital interface.
The best option depends on the situation. Digital maps are convenient for navigation, while paper maps can still be useful for education, planning, outdoor activities, and situations where technology is unavailable.
Why Understanding Types of Maps Matters
Learning different map types helps people choose the right geographic information for a specific purpose.
A map is more than a picture of a place. It is a way of organizing information so that people can understand locations, relationships, patterns, and changes.
Students who learn how different maps work can develop stronger geographic and spatial thinking skills. These skills can be useful in subjects ranging from geography and environmental science to history and urban planning.
Understanding maps can also make everyday tasks easier, from planning a journey to understanding a weather forecast.
Frequently Asked Questions
What are the main types of maps?
The main types include political, physical, topographic, road, thematic, climate, weather, population, geological, and economic maps. Each type is designed to communicate different information.
What is a political map?
A political map shows human-made boundaries such as countries, states, provinces, and other administrative regions. It may also identify major cities and capitals.
What is a physical map?
A physical map shows natural features such as mountains, rivers, lakes, deserts, and oceans. It often uses colors to represent terrain and elevation.
What is a thematic map?
A thematic map focuses on a specific subject or theme. Examples include population, rainfall, agriculture, income, and economic activity maps.
What is the difference between a weather map and a climate map?
A weather map generally shows current or short-term atmospheric conditions. A climate map shows longer-term patterns such as average temperature, precipitation, or climate zones.
Which map shows elevation?
Topographic maps are commonly used to show elevation and the shape of land. Contour lines are an important feature of these maps.
Why are maps important?
Maps help people understand locations, distances, boundaries, natural features, and geographic patterns. They are useful in education, navigation, science, planning, and many other areas.
Conclusion
The different types of maps exist because people need different kinds of geographic information. Political maps show boundaries, physical maps display natural features, topographic maps explain terrain, and thematic maps focus on specific subjects.
Other maps, including weather, climate, population, economic, resource, and geological maps, provide more specialized information.
Modern digital technology has made maps easier to access and use, but the basic purpose of mapping remains the same: to help people understand the world around them.
Learning how to identify and read different map types is therefore a valuable skill for students, travelers, researchers, and anyone who wants to understand geographic information more clearly.
- U.S. Geological Survey — Maps & Mapping
USGS Maps & Mapping
Best placement: Introduction or general map-types section. - USGS — Topographic Maps
USGS Topographic Maps
Best placement: “Topographic Maps” section. - National Geographic Society — Map
National Geographic: Map
Best placement: “What Are the Different Types of Maps?” section. - Library of Congress — Maps
Library of Congress Maps
Best placement: Trusted Sources section. - USGS — Geographic Information Systems (GIS)
USGS Geographic Information Systems
Best placement: “Digital Maps vs. Paper Maps” section.