
How Is the Consumer Price Index (CPI) Calculated? A Complete Guide
The Consumer Price Index (CPI) is one of the most important economic indicators in the United States. If you have ever wondered how is the CPI calculated, the answer starts with tracking the prices of thousands of everyday goods and services that people buy. From groceries and rent to gasoline and healthcare, the CPI measures how the cost of living changes over time.
Governments, businesses, investors, and consumers use the Consumer Price Index to understand inflation and make informed financial decisions. A rising CPI usually signals higher inflation, while a stable or falling CPI may indicate slower price growth. Because of its impact on wages, taxes, Social Security benefits, and monetary policy, the CPI plays a major role in the U.S. economy.
In this guide, you’ll learn how the CPI is calculated, the formula behind it, how the U.S. Bureau of Labor Statistics collects price data, and why this measurement matters for everyone.
What Is the Consumer Price Index (CPI)?
The Consumer Price Index (CPI) measures the average change in prices paid by urban consumers for a fixed basket of goods and services over time. It helps show whether the cost of living is increasing, decreasing, or staying the same.
Instead of tracking the price of a single product, the CPI follows hundreds of categories that represent everyday spending. These include housing, food, transportation, medical care, education, apparel, recreation, and many other household expenses.
Economists use the CPI to measure inflation because it reflects the purchasing habits of millions of consumers. When prices rise across many categories, the CPI increases. When prices remain stable or fall, the CPI changes more slowly or even declines.
Although the CPI is widely used, it does not represent the spending habits of every individual. Instead, it provides an average picture of price changes across urban households in the United States.
Who Calculates the CPI?
The U.S. Bureau of Labor Statistics (BLS) is responsible for calculating and publishing the Consumer Price Index every month. The BLS is a federal agency that collects economic data and follows strict statistical methods to ensure accuracy and consistency.
Each month, trained data collectors gather price information from thousands of retail stores, service providers, rental properties, hospitals, schools, and online retailers across the country. The agency also conducts consumer expenditure surveys to understand how households spend their money.
Using this information, the BLS calculates the CPI through a standardized process that has been refined over decades. This consistent methodology allows economists and policymakers to compare inflation over time without changing the underlying calculation process.
Because the CPI follows internationally recognized statistical practices, it is considered one of the most trusted measures of inflation in the world.
How Is the CPI Calculated?
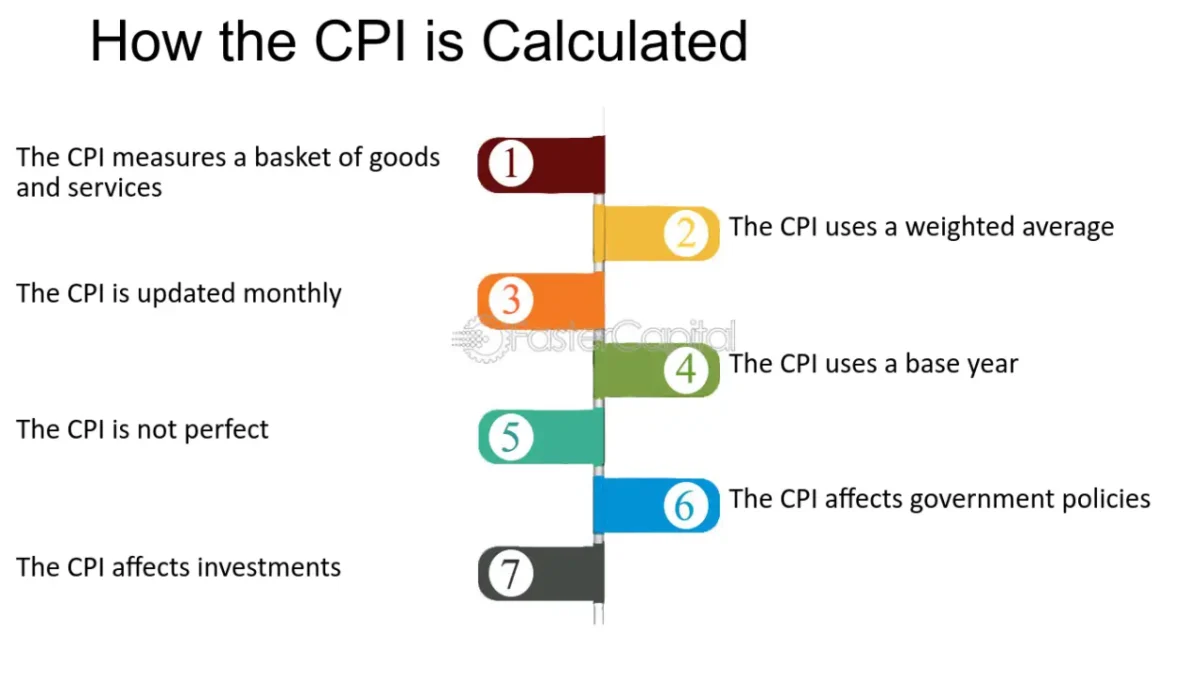
Calculating the Consumer Price Index is a detailed process that involves collecting prices, analyzing consumer spending, assigning spending weights, and comparing current prices with those from a base period. Rather than relying on estimates, the BLS uses millions of real price observations every year to produce reliable inflation data.
The calculation follows several important steps.
Step 1 – Selecting the Market Basket
The first step is creating what economists call the market basket. This basket represents the products and services that a typical urban consumer buys during everyday life.
The basket includes hundreds of different items across major spending categories. These categories include housing, food and beverages, transportation, medical care, education, recreation, apparel, communication, and other everyday expenses.
The contents of the basket are based on nationwide consumer expenditure surveys. These surveys help the BLS understand what households actually spend money on instead of assuming spending patterns.
The market basket is updated periodically to reflect changes in consumer behavior. For example, new products and services may be added as buying habits evolve.
Step 2 – Collecting Prices
After the market basket is established, the BLS begins collecting prices from across the country.
Every month, data collectors visit or contact thousands of businesses to record the prices of products and services included in the market basket. They also gather rental information from housing surveys and collect prices from online retailers where appropriate.
This process results in hundreds of thousands of price observations every month. By collecting data from different cities and regions, the BLS captures a broad picture of price movements across the United States.
The agency follows strict quality standards to ensure that the same products or comparable alternatives are measured consistently over time.
Step 3 – Assigning Spending Weights
Not every product has the same impact on household spending. Housing, for example, usually takes a much larger share of a family’s budget than movie tickets or clothing.
To reflect real spending patterns, the BLS assigns weights to every category in the market basket. Categories where consumers spend more money receive higher weights, while categories with lower spending receive smaller weights.
Housing generally carries the largest weight because it represents one of the biggest monthly expenses for most households. Food, transportation, and healthcare also receive significant weights because they account for a large portion of consumer spending.
Using weighted categories makes the CPI more accurate because it reflects how people actually allocate their budgets.
Step 4 – Comparing Current Prices with the Base Period
Once prices have been collected, the BLS compares today’s prices with prices from a designated base period.
The base period serves as a benchmark and is assigned an index value of 100. If the average cost of the market basket increases over time, the CPI rises above 100. If prices decrease, the index moves closer to or below the base value.
This comparison allows economists to measure inflation as a percentage change rather than simply looking at dollar amounts.
Because every monthly calculation uses the same reference point, it becomes easier to track long-term trends in inflation and purchasing power.
Step 5 – Applying the CPI Formula
After collecting prices and assigning weights, the BLS calculates the Consumer Price Index using a standardized formula.
CPI Formula
CPI = (Cost of Market Basket in Current Period ÷ Cost of Market Basket in Base Period) × 100
This formula converts the change in prices into an index value that can be compared across months and years.
A higher CPI indicates that the overall cost of goods and services has increased compared with the base period, while a lower CPI suggests slower price growth or lower overall prices.
Because the calculation uses weighted spending categories, the final CPI reflects changes in the prices consumers experience in everyday life rather than changes in a single product.
Simple Example of CPI Calculation
Imagine the total cost of a market basket was $1,000 during the base period.
A few years later, the same basket costs $1,120.
Using the CPI formula:
CPI = ($1,120 ÷ $1,000) × 100 = 112
This means the Consumer Price Index has increased to 112, showing that the average cost of the selected goods and services has risen by 12% since the base period.
Although this example is simplified, the actual CPI calculation follows the same principle. The main difference is that the Bureau of Labor Statistics uses thousands of weighted products and services instead of a small sample, making the published CPI a reliable measure of inflation across the economy.
What Items Are Included in the Consumer Price Index (CPI)?
The Consumer Price Index measures much more than the price of a few common products. It reflects the cost of a broad range of goods and services that people purchase regularly. By tracking prices across many spending categories, the CPI provides a more accurate picture of inflation and changes in the cost of living.
The market basket includes hundreds of individual items grouped into major categories. Each category represents a different part of household spending and contributes to the final CPI based on its assigned weight.
| Major Category | Examples |
|---|---|
| Housing | Rent, owners’ equivalent rent, utilities, maintenance |
| Food and Beverages | Groceries, restaurant meals, snacks, beverages |
| Transportation | Gasoline, vehicle purchases, public transportation, car insurance |
| Medical Care | Doctor visits, hospital services, prescription drugs |
| Education | Tuition, textbooks, school supplies |
| Apparel | Clothing, footwear, accessories |
| Recreation | Streaming services, sporting events, hobbies |
| Communication | Internet, mobile phone services |
| Other Goods and Services | Personal care products, financial services, tobacco products |
Housing carries the largest weight in the CPI because it represents the biggest monthly expense for most households. Food and transportation also have significant influence due to their importance in everyday spending.
The Bureau of Labor Statistics regularly reviews the market basket to ensure it reflects changing consumer habits. As new products become common and spending patterns shift, the basket is updated to remain representative of how people actually spend their money.
How Often Is the CPI Calculated?
The Consumer Price Index is calculated every month by the U.S. Bureau of Labor Statistics. Monthly updates allow economists, businesses, and policymakers to monitor inflation trends without waiting for annual reports.
The BLS collects price information throughout the month from thousands of stores, service providers, and housing units across the country. After reviewing and processing the data, the agency publishes the official CPI report according to its annual release schedule.
Monthly reports help identify whether inflation is accelerating, slowing down, or remaining stable. These updates are closely watched by financial markets because they can influence interest rate decisions, investment strategies, and consumer confidence.
In addition to monthly figures, economists often compare CPI data over three-month, six-month, and yearly periods to better understand long-term inflation trends.
What Data Is Used to Calculate the CPI?
The accuracy of the Consumer Price Index depends on collecting reliable information from a wide range of sources. Instead of relying on estimates, the Bureau of Labor Statistics gathers actual price data from businesses and households across the United States.
Consumer Expenditure Surveys
The BLS conducts nationwide surveys to learn how families spend their income. These surveys determine which goods and services belong in the market basket and how much weight each category should receive.
Consumer spending habits change over time. Regular surveys help keep the CPI aligned with modern purchasing behavior.
Retail Price Collection
Every month, BLS representatives collect prices from grocery stores, department stores, pharmacies, gas stations, restaurants, and many other businesses.
The agency also gathers prices from online retailers when appropriate, reflecting the growing role of e-commerce in consumer spending.
Housing Surveys
Housing is the largest component of the Consumer Price Index. To measure housing costs accurately, the BLS collects rental information from thousands of housing units across the country.
The agency also estimates owners’ equivalent rent, which reflects what homeowners would pay if they rented their own homes.
Medical and Service Providers
Medical care prices are collected from hospitals, clinics, doctors’ offices, and pharmacies.
Other services, including education, transportation, communication, and recreation, are also surveyed to ensure the CPI reflects a wide range of consumer expenses.

Why Is the Consumer Price Index Important?
The Consumer Price Index affects far more than inflation headlines. It influences government policy, business decisions, investment strategies, and household budgets across the country.
Because the CPI reflects changes in the cost of living, it serves as one of the most widely used economic indicators in the United States.
For Consumers
Consumers use CPI data to understand how rising prices affect their purchasing power.
When inflation increases, households may need to adjust their budgets because everyday expenses become more expensive. Monitoring CPI trends helps families make informed financial decisions and plan future spending.
For Businesses
Businesses rely on CPI reports when setting prices, forecasting demand, and planning future investments.
Companies often use inflation data to estimate operating costs and negotiate supplier contracts. Understanding price trends also helps businesses prepare for changing consumer behavior.
For Investors
Investors closely monitor CPI releases because inflation can influence stock prices, bond yields, and market expectations.
Higher-than-expected inflation may lead investors to anticipate interest rate increases, while lower inflation can create a different market outlook.
For the Federal Reserve
The Federal Reserve uses CPI data as one of several indicators when making monetary policy decisions.
Although the Fed also considers the Personal Consumption Expenditures (PCE) Price Index, CPI remains one of the most closely watched inflation measures in the financial world.
Changes in inflation often influence decisions regarding interest rates, which affect borrowing costs for consumers and businesses.
For Government Programs
Many government programs use CPI data to adjust benefits and payment amounts over time.
Social Security cost-of-living adjustments (COLA), certain tax provisions, and other federal programs are linked to inflation measurements to help maintain purchasing power.
What Can Affect the Consumer Price Index?
Many economic factors influence changes in the Consumer Price Index. Some affect only a few categories, while others can impact prices across the entire economy.
Understanding these factors helps explain why inflation rises during some periods and slows during others.
Oil and Energy Prices
Energy prices have a direct impact on transportation, manufacturing, and household utility costs.
When oil prices increase, businesses often face higher operating expenses. These additional costs may eventually be passed on to consumers through higher prices for goods and services.
Supply Chain Disruptions
Supply chain problems can reduce the availability of products while increasing transportation and production costs.
When demand remains strong but supplies become limited, businesses may raise prices, causing upward pressure on the Consumer Price Index.
Global events, shipping delays, and manufacturing disruptions have all contributed to inflation during recent years.
Interest Rates
Interest rates influence consumer borrowing and overall economic activity.
Higher interest rates generally reduce spending and borrowing, which can slow inflation over time. Lower interest rates often encourage spending and investment, potentially increasing demand and putting upward pressure on prices.
Consumer Demand
Consumer demand plays an important role in inflation.
When people spend more money on goods and services than businesses can supply, prices often rise. If demand weakens, businesses may reduce prices or slow future price increases.
Government Policies and Tariffs
Taxes, tariffs, and government regulations can affect production costs for businesses.
When import costs increase because of tariffs or trade restrictions, companies may pass some of those additional expenses on to consumers through higher prices.
Government spending programs can also influence demand and inflation depending on overall economic conditions.
Natural Disasters and Weather Events
Extreme weather, hurricanes, floods, droughts, and other natural disasters can disrupt agricultural production, transportation, and energy supplies.
These disruptions may temporarily increase the prices of food, fuel, construction materials, and other essential goods, contributing to higher CPI readings.
By considering all of these factors together, economists gain a clearer understanding of why inflation changes over time and how different events influence the prices consumers pay every day.
Limitations of the Consumer Price Index
Although the Consumer Price Index is one of the most trusted measures of inflation, it is not perfect. Like any economic indicator, the CPI has limitations that users should understand before making financial or policy decisions.
The CPI represents the average spending patterns of urban consumers rather than every individual household. People’s lifestyles, incomes, and purchasing habits vary significantly, so actual inflation experienced by one family may differ from the official CPI.
Below are some of the key limitations of the Consumer Price Index.
Substitution Bias
Consumers often change their buying habits when prices rise. For example, if beef becomes more expensive, some households may buy chicken instead.
Because the CPI is based on a fixed market basket, it may not immediately reflect these changes in consumer behavior. This can sometimes cause the index to slightly overstate inflation.
Quality Changes
Many products improve over time through better technology, safety features, or performance.
For example, today’s smartphones offer significantly more features than older models. The Bureau of Labor Statistics adjusts for quality improvements whenever possible, but measuring these changes accurately remains challenging.
Regional Price Differences
Prices do not increase at the same rate everywhere.
Housing costs in large metropolitan areas may rise much faster than in smaller cities or rural communities. Since the national CPI represents an average, it may not fully reflect local inflation experienced in a specific region.
Introduction of New Products
Consumer preferences continue to evolve as new products and services enter the market.
It takes time for these products to become part of the official market basket. As a result, the CPI may not immediately capture changing spending habits after new technologies or services become popular.
CPI vs. Inflation
Many people use the terms CPI and inflation interchangeably, but they are not exactly the same.
Inflation is the overall increase in the prices of goods and services across an economy over time. It is an economic condition rather than a single statistic.
The Consumer Price Index is one of the primary tools used to measure inflation. It tracks changes in the prices consumers pay for a fixed basket of goods and services.
Simply put, inflation is the economic phenomenon, while the CPI is one of the measurements used to track it.
CPI vs. Producer Price Index (PPI)
Although both indexes measure price changes, they focus on different parts of the economy.
The Consumer Price Index measures the prices paid by consumers for everyday goods and services.
The Producer Price Index (PPI) measures the prices businesses receive when selling their products before they reach consumers.
Because producer costs often change before retail prices, economists frequently monitor the PPI as an early indicator of future inflation.
Businesses, manufacturers, and investors commonly analyze both indexes together to better understand inflation trends throughout the supply chain.
CPI vs. Core CPI
The headline Consumer Price Index includes all goods and services in the market basket.
Core CPI removes food and energy prices because these categories tend to experience large short-term price swings caused by weather events, global conflicts, or supply disruptions.
Economists often focus on Core CPI when evaluating long-term inflation trends because it provides a more stable picture of underlying price movements.
However, both headline CPI and Core CPI are important, as consumers still spend a significant portion of their income on food and energy.
Frequently Asked Questions (FAQs)
What does the Consumer Price Index measure?
The Consumer Price Index measures the average change in prices paid by urban consumers for a basket of goods and services over time. It is one of the most widely used indicators of inflation.
Who calculates the CPI?
The Consumer Price Index is calculated and published every month by the U.S. Bureau of Labor Statistics (BLS).
How is the CPI calculated?
The CPI is calculated by comparing the current cost of a weighted market basket of goods and services with its cost during a base period. The result is converted into an index using the standard CPI formula.
Why is housing so important in the CPI?
Housing represents one of the largest expenses for most households, so it carries the highest weight in the Consumer Price Index.
Is the CPI the same as the inflation rate?
Not exactly. The CPI is an index used to measure inflation. The inflation rate is the percentage change in the CPI over a specific period.
How often is the CPI updated?
The U.S. Bureau of Labor Statistics releases updated Consumer Price Index data every month according to its official publication schedule.
Why do investors watch CPI reports?
Investors monitor CPI reports because inflation influences interest rates, stock prices, bond markets, and overall economic expectations.
Does the CPI include every product people buy?
No. The CPI is based on a representative market basket that reflects typical consumer spending rather than every individual purchase.
Conclusion
Understanding how the CPI is calculated helps explain how economists measure inflation and track changes in the cost of living. Instead of relying on a single product or price, the Consumer Price Index uses a carefully selected market basket, weighted spending categories, and millions of real-world price observations to provide a reliable picture of consumer inflation.
The U.S. Bureau of Labor Statistics follows a consistent methodology that includes collecting prices, assigning category weights, comparing costs with a base period, and applying a standardized formula. This process allows governments, businesses, investors, and consumers to make informed financial decisions based on accurate inflation data.
Although the CPI has some limitations, it remains one of the most trusted economic indicators in the world. Whether you are monitoring household expenses, analyzing financial markets, or studying economic trends, understanding how the Consumer Price Index works provides valuable insight into the health of the economy.
- U.S. Bureau of Labor Statistics (CPI Home)
- BLS – Consumer Price Index Handbook of Methods
- BLS – CPI Frequently Asked Questions
- Federal Reserve
- Bureau of Economic Analysis (BEA)
- FRED (Federal Reserve Economic Data) – Consumer Price Index



[…] panic. To understand how price pressures unfold across different sectors, analysts study how how is the cpi calculated using baskets of common household items. Rising costs can sometimes trigger currency devaluation […]